
Replay of 2025?
- Scott Poore

- Feb 6
- 6 min read

Are markets carrying out a replay of 2025? February is typically a precarious month for the markets, but early weakness in technology stocks is driving the S&P 500 Index lower,

but much of the market is holding up well. Should investors stay put or is the temptation too great to run for the hills? The inspiration for this week's musings is the 1981 song, "Tempted" by the British band Squeeze. Here’s some trivia about the song:
This song was a moderate hit in 1981, only reaching #8 on the U.S. Billboard charts. However, it was their first hit in the U.S. and has since become their most notable song appearing in movies, television shows, and commercials.
This song was released on the "East Side Story" album that was actually produced by Elvis Costello. In fact, it was Costello who suggested that keyboardist Paul Carrack sing the lead vocals on this song. In addition, you can also hear Costello singing in the background on the second verse.
The inspiration for the song was a taxi ride to Heathrow Airport. Band member and main lyricist Chris Difford wrote about the sights of the ride and about a relationship that had failed.
The song has been used in "Reality Bites" (1994) and in several TV shows - "Glee" (2011), "The Office" (2006), and "The Carrie Diaries" (2013).
"I bought a toothbrush, some toothpaste
A flannel for my face
Pajamas, a hairbrush
New shoes and a case
I said to my reflection
'Let's get out of this place'
Tempted by the fruit of another
Tempted but the truth is discovered
What's been going on
Now that you have gone
There's no other
Tempted by the fruit of another
Tempted but the truth is discovered"
Here's what we've seen so far this week...
What's Been Going On? No two markets are exactly alike, but sometimes they can perform similarly, even if for completely different reasons. Last year, there was the

increase in tariffs and questions about if the Fed would continue cutting rates. That led to a sell off that started in late February and ended in early April. Over that time period, the S&P 500 Index was down more than 17%. Yet, despite that deep correction, the index finished the year up more than 15%. The mayhem in the metals market and geopolitical threats have caused equities to once again show weakness. Will it be a repeat of early 2025?
Seasonality would suggest that another correction in February is possible. Looking back over the past 20 years, February is one of the worst months of the year and has

only a 50:50 probability of ending the month positive. On the other hand, March and April tend to be much stronger months with a 63% and 79% probability, respectively, and ending the month higher or positive. On top of the seasonal weakness, the U.S. shot down two Iranian drones aggressively targeting U.S. naval vessels this week. Congress has passed a temporary end to the government shutdown that will be rehashed later this month (regarding DHS funding) and later this year in September when funding will need to be renegotiated.
On top of all this, the selloff in technology stocks has been the steepest. Year-to-date, technology stocks are down more than 5%. However, not all sectors are taking it on the

chin. Of the major sectors of the S&P 500, 6 are positive year-to-date. However, we have a math problem. Technology stocks make up more than 33% of the Index. While 6 sectors are positive for the year, they only comprise 22.5% of the Index, while the 5 sectors that are negative for the year make up more than 77% of the Index. High valuations for tech names and questions surrounding the profitability of AI has caused those stocks to pull back from previous highs. That being said, market breadth is still healthy. More than 66% of stocks in the S&P 500 are above their 200-day moving averages and new lows on the New York Stock Exchange are below what would be considered a "high risk" environment. Some de-risking and consolidation in the markets is typically a healthy thing and not necessarily associated with the beginning of a bear market.
Tempted, But The Trust Is Discovered. With robust economic growth and improving fundamentals, it's hard to see the case for a recession. In fact, the ISM Manufacturing
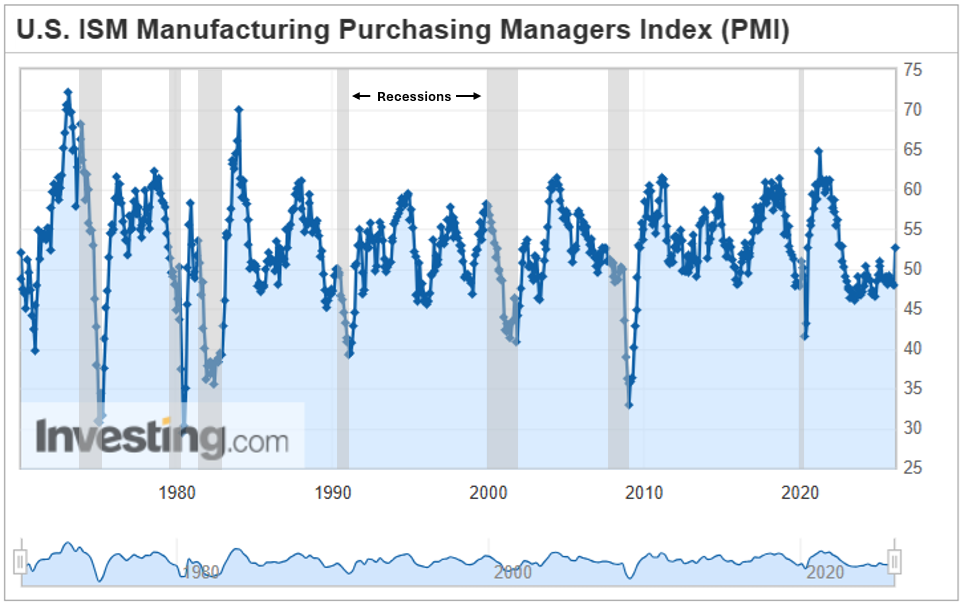
PMI has been at or below 50 for the past 9 months. When this index is below 50, the manufacturing sectors is generally considered to be contracting. However, this week the index jumped from 47.9 to 52.6. We haven't seen a one-month move that strong since 2021. Since the ISM Manufacturing PMI began, we have never seen a recession begin when the Index was making fresh 3-year highs while economic growth was north of 3%.
Speaking of economic growth, the Atlanta Fed has 4th quarter GDP coming in higher than 4%. We will get the first reading of Q4 GDP in two weeks, but the weekly data

seems to support the high GDP estimation. The weekly economic index tracked by the St. Louis Federal Reserve shows a reading north of 2.0, which is accompanied by economic expansion, not contraction. A reading of 0.0 or less is associated with recessions. Redbook Sales, which dipped slightly last week, are still at +6.7%, which is well above the +4.4% historical average. Consumers drive the economy and they appear to be spending.
Finally, though the Fed appears to be in wait-and-see mode with regard to interest rates, inflation appears to be cooperating. Fed Chairman Powell stated that he
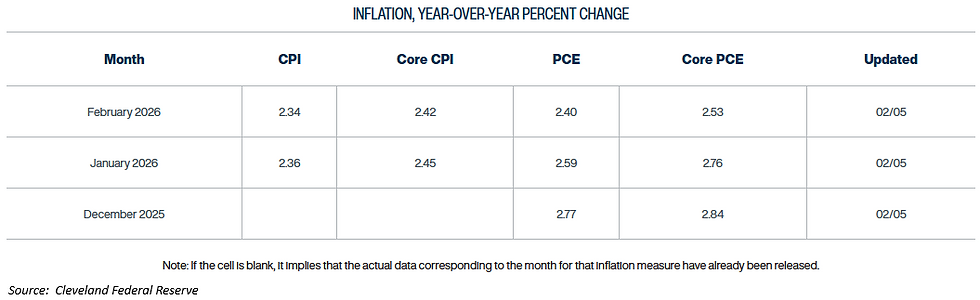
expected inflation to taper off after a higher-than-expected print in September of last year. According to the Cleveland Federal Reserve, their inflation expectation for January is +2.4%, which if true, would be a decline of -0.3% compared to December. Their February expectation is for inflation to be nearly flat at +2.4%. If those expectations become reality, the consumer would have some tailwinds and spending should remain elevated. For now, the ride may be bumpy with some profit-taking and consolidation, but staying invested is the better option versus taking losses due to market volatility.
P.S. - A Note On Metals. There has been considerable movement in the metals market lately, especially silver. This movement has bled over into other metals and liquid equity names that are highly appreciated - something we saw during the Yen Carry Trade of 2024. What we are witnessing is not a fundamental shift in the metals supply and demand structure. Several notable sources, including the COMEX exchange itself, have noted suspicious trading activity regarding the paper price of silver. Lease rates on silver have risen, which tells us that the physical demand for silver has not collapsed, rather there was an over-abundance of leverage in the paper price of silver. The Silver Institute reports that demand for silver still remains elevated and exceeds supply. In fact, demand remains 16% higher than it was 10 years ago, while supply is is 2% lower over the same time period. Another element to the plunge in the price of silver is the arbitrage opportunity between Shanghai prices and prices in the West. This has further depressed U.S. silver prices. Make no mistake about it, the price movement we have witnessed is extraordinary. Over the last 55 years, silver has seen considerable drawdowns from 12-month highs at least 10 times, prior to this year. The average drawdown was -25% and averaged 41 days to reach a new low. This year, in just 8 days we've seen the price of silver decline 39%. It's hard to know who and how much leverage has been washed out of the system, but metal prices seem to have settled down so far in trading this morning. We will see if that becomes a more sustainable trend.


Here's the "Tempted" video for those who grew up with MTV...
___________________________________________________________________________
Disclosures
The information contained herein is for informational purposes only and is developed from sources believed to be providing accurate information. The opinions expressed are those of the author, are for general information, and should not be considered a solicitation for the purchase or sale of any security. The decision to review or consider the purchase or sell of any security should not be undertaken without consideration of your personal financial information, investment objectives and risk tolerance with your financial professional.
Forecasts or forward-looking statements are based on assumptions, may not materialize, and are subject to revision without notice.
Any market indexes discussed are unmanaged, and generally, considered representative of their respective markets. Index performance is not indicative of the past performance of a particular investment. Indexes do not incur management fees, costs, and expenses. Individuals cannot directly invest in unmanaged indexes. The S&P 500 Composite Index is an unmanaged group of securities that are considered to be representative of the stock market in general.
Past Performance does not guarantee future results.

Comments